What are the advantages of looking at SSC using a logarithmic (rather than linear) scale?
Looking at side scattered using the logarithmic scale (log) is advantageous in visualization of data where there is a wide range of fluorescence intensities (see figure 1) however some argue that the linear scale (lin) shows better population separation with light scatter (see figure 2). Ultimately, the choice of looking at side scatter parameters in either log or lin scaling is a matter of personal preference and comfort, and, in a small informal survey, there is a roughly equal distribution of clinical users who look at side scatter on log and lin. Most people agree, in the case of light scatter parameters, these data transformations do not result in significantly different interpretations.
The key points to remember when choosing one scale over the other is:
Developing your pattern recognition in one format or the other
Avoid changes to the laboratory standard (should be documented in the laboratory SOP)
Carefully set the discriminator/live gate (on the cytometer at collection time) to eliminate the bulk of non-viable events/cellular debris however leave enough non-viable events so that you can correctly adjust a fs/ss viability gate.
Of note, appropriate scaling of the data is of the utmost importance especially when viewing data on the linear scale (see figure 3).
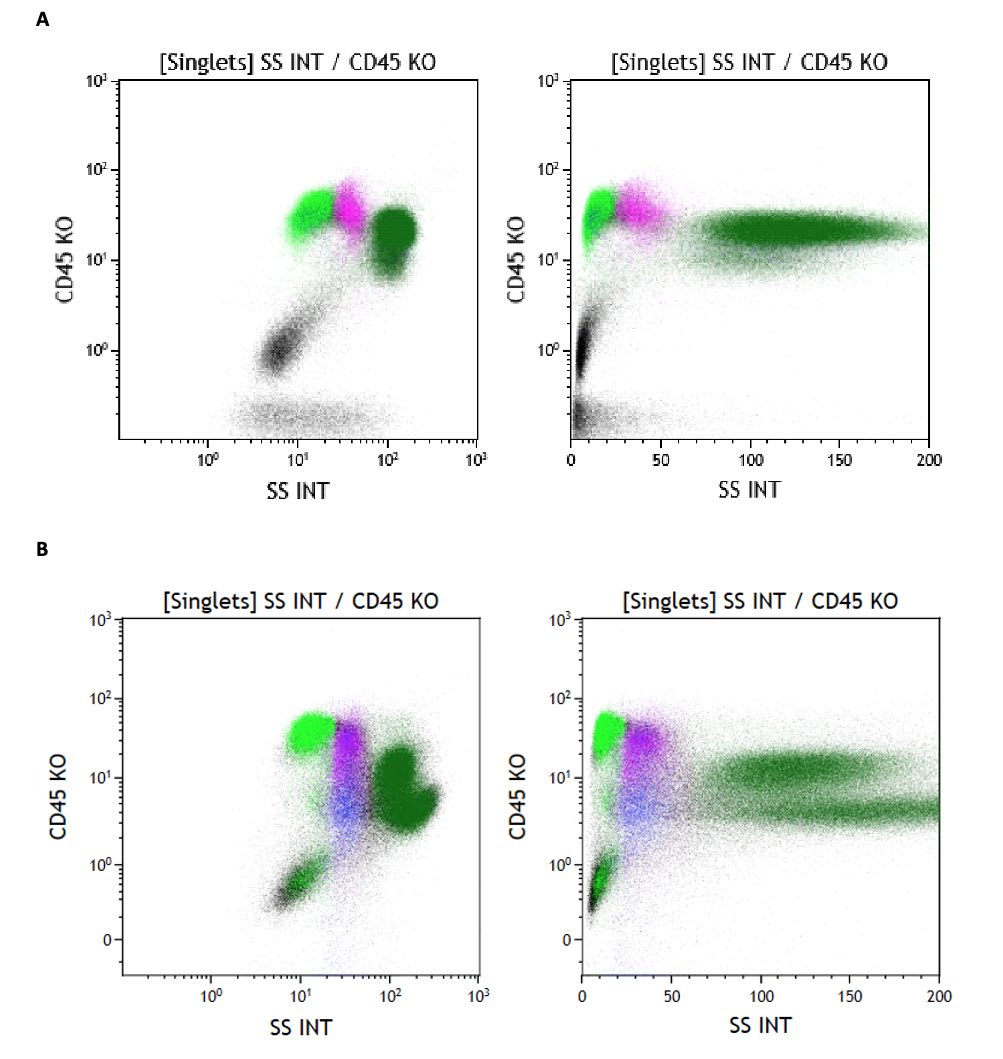
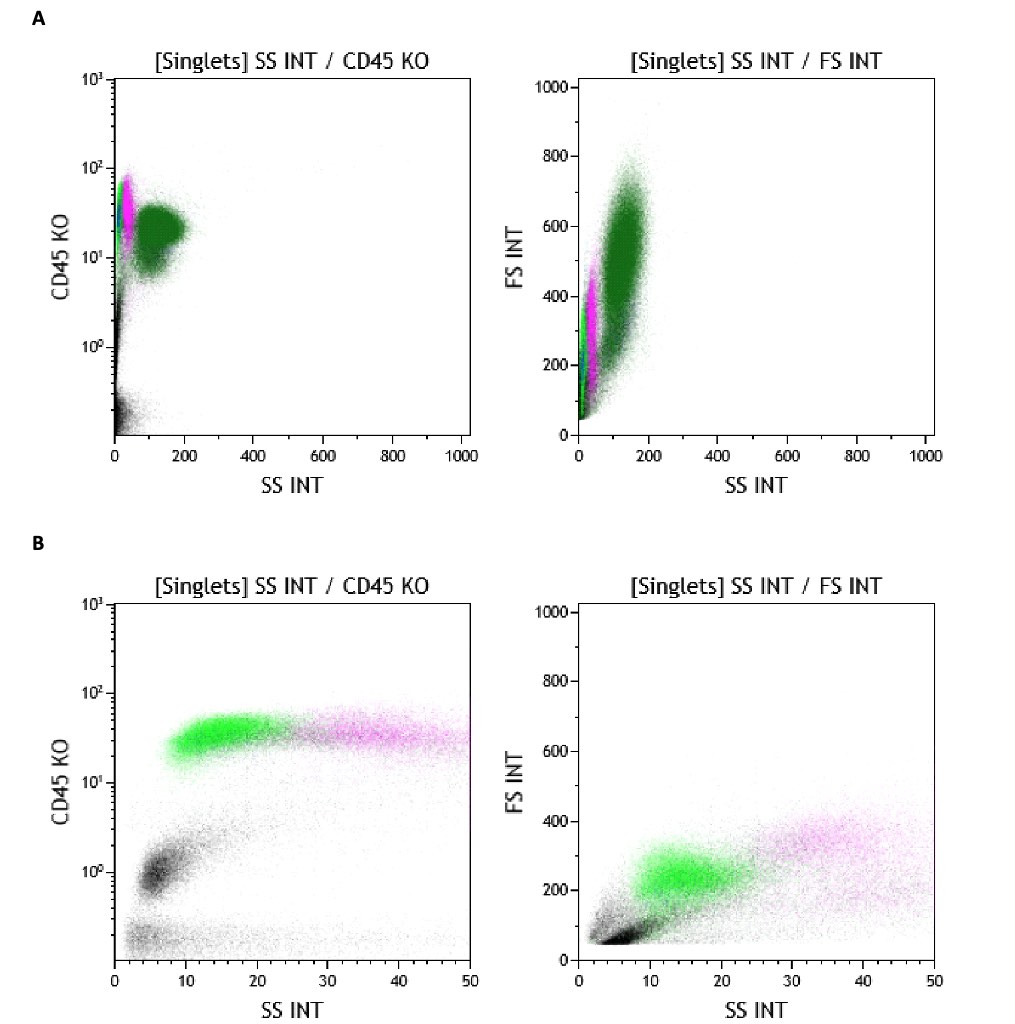
Figure 1 Dot plots showing side scatter (Left: log and Right: linear) versus forward scatter. A: Peripheral Blood, B: Bone Marrow. Color Key: Dark Green- Granulocytes, Magenta - Monocytes, Light Green - Lymphocytes, Blue - Blast Gate(45/SS)
Figure 2 Dot plots showing side scatter (Left: log and Right: linear) versus CD45. A: Peripheral Blood, B: Bone Marrow.
Figure 3 The importance of appropriately scaling data when using linear scale (n.b. some software packages can automatically scale the data "autoscale" to varying degrees of success). A shows too wide a range [0,1024], limiting resolution/discrimination on the lymphocytes and monocytes. B shows too narrow a range [0,50] thereby cutting off the granulocytes.
David P. Ng, MD
University of Utah
Reviewers:
Saja Asakrah MD, PhD
Bakul Dalal MD
Huifei Liu MD, PhD